January 8, 2025
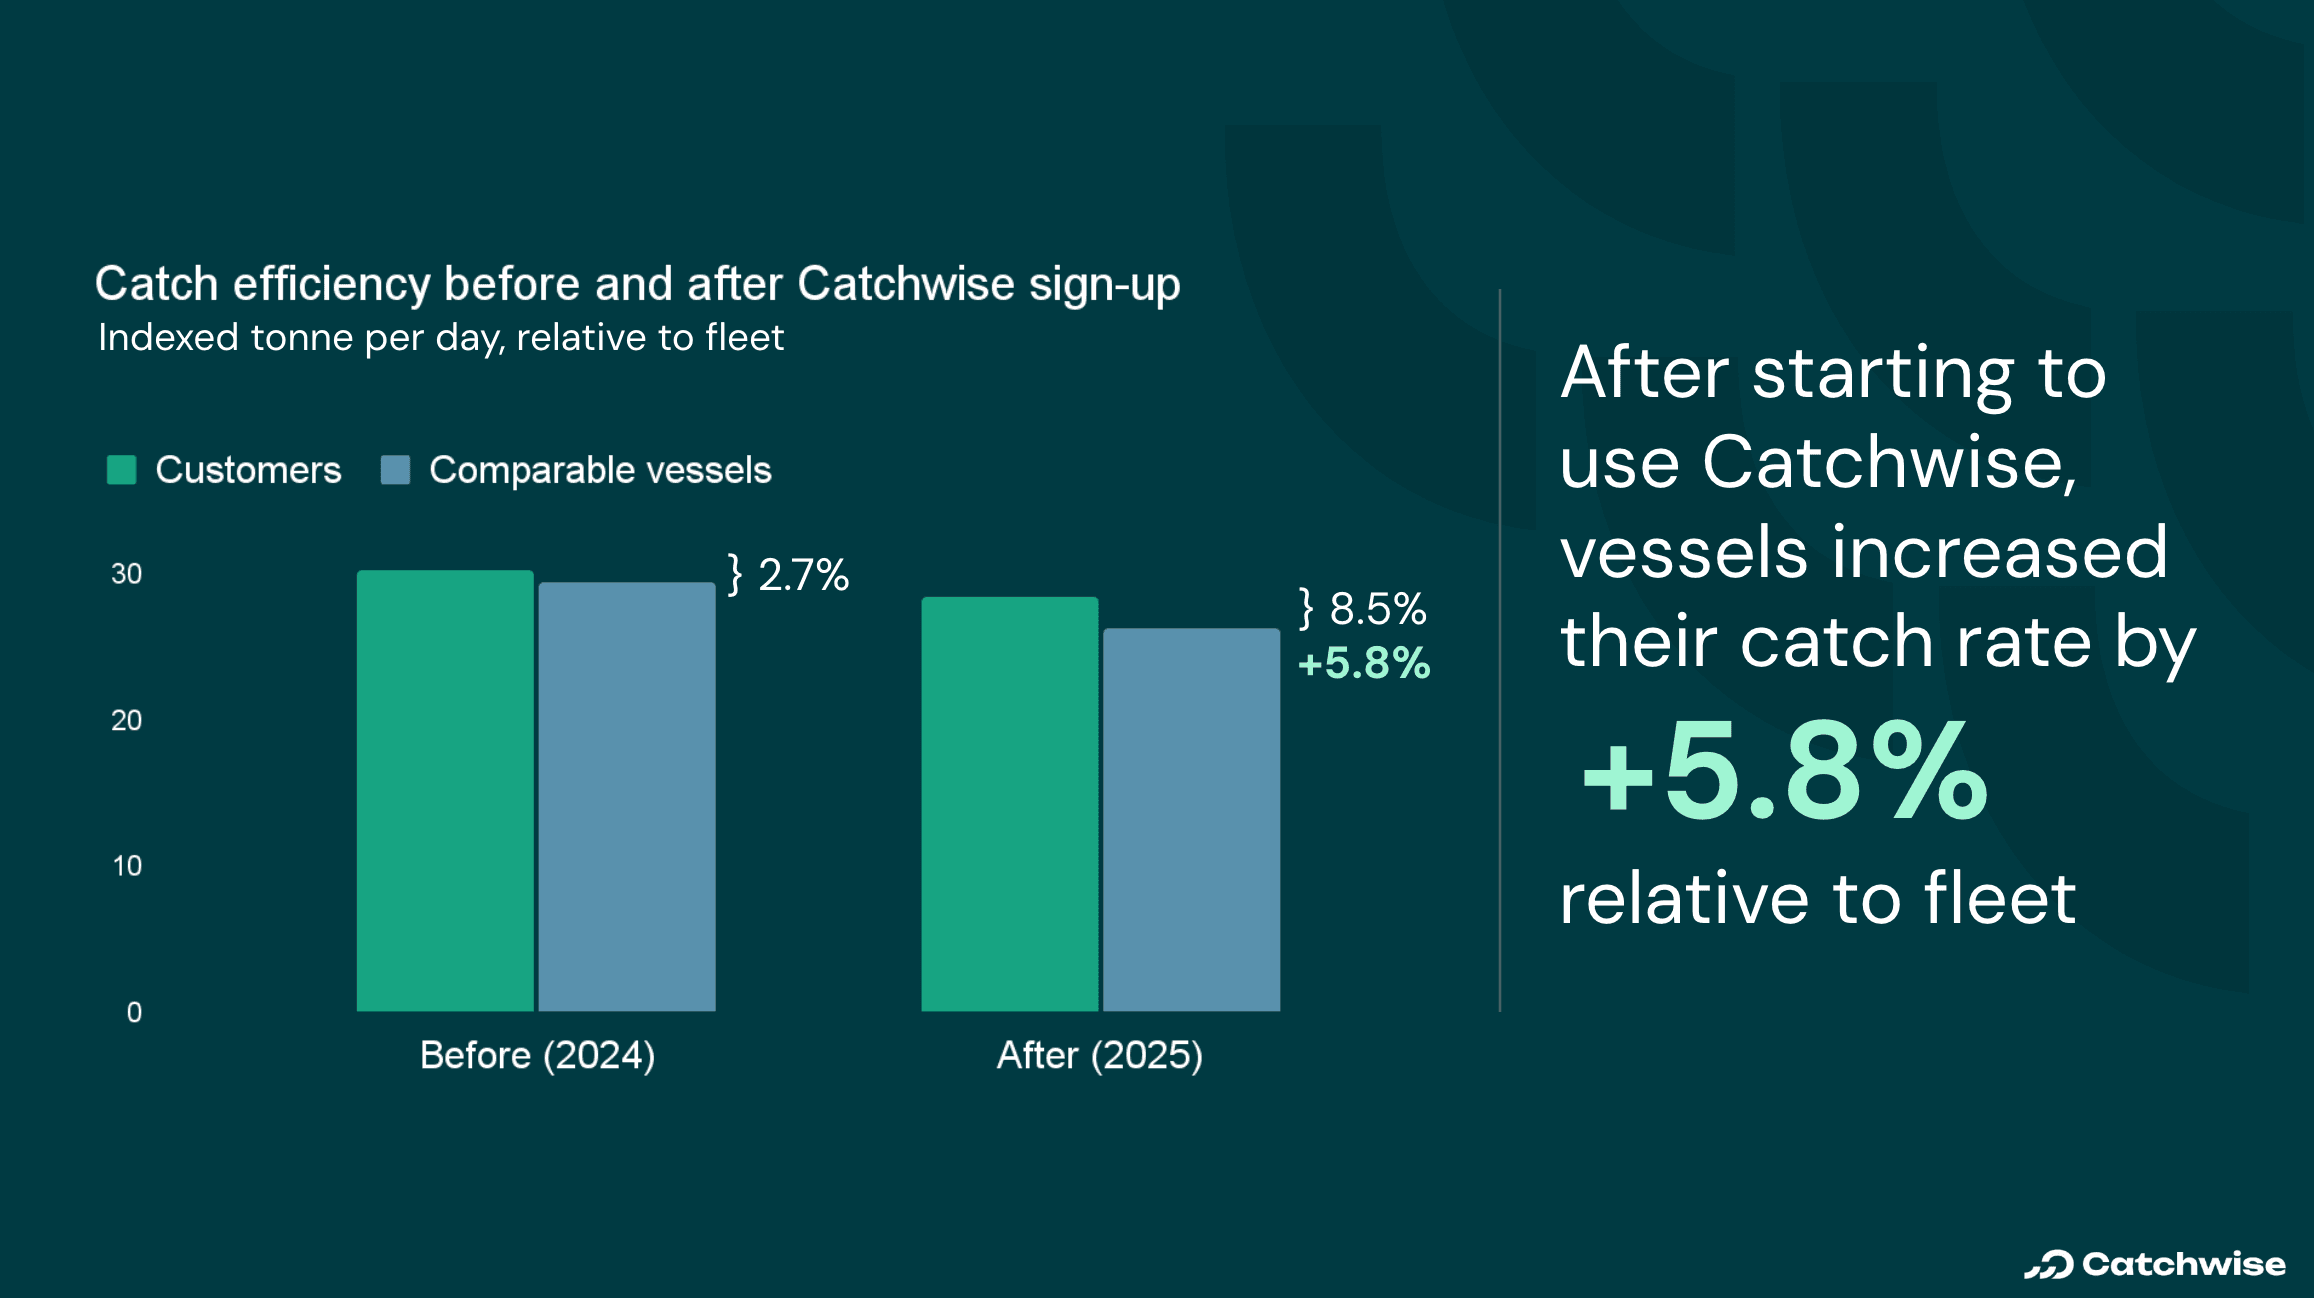
Catchwise Users Improve Catch Efficiency Relative to Comparable Vessels
A before-and-after analysis of 69 vessels shows that Catchwise customers, on average, perform better relative to comparable vessels than they did before using Catchwise.
Written by
Ludvig Løddesøl
Kristian Hole
Tomas Roaldsnes
Skippers often ask us a fair question:
“Does Catchwise actually make a measurable difference?”
It’s a reasonable thing to ask. Fishing is unpredictable. Stocks move. Weather changes. Quotas and regulations matter. A single good or bad trip proves nothing.
So instead of looking at anecdotes, we looked at data.
This is our baseline, public analysis of catch efficiency in the fleet—so customers and skeptics can inspect the method, the variation, and the limits.
What We Analyzed
We analyzed 69 Catchwise vessels with clear before-and-after periods.
The comparison pool included 354 Norwegian vessels.
We compare each Catchwise vessel with similar vessels (same gear type, similar size) fishing in the same period. Efficiency is measured as tons caught per day at sea.
The dataset includes 3,846 trips.
Results are weighted by time at sea to avoid short or inactive periods skewing results. (Details in method notes.)
What We Found
Across all vessels with before-and-after data:
+5.8 percentage points higher efficiency relative to comparable vessels
95% confidence interval: +1.0 to +10.9 percentage points
Median improvement: +5.0 percentage points
61% of vessels improved relative to their own baseline
39% declined or showed no clear change
The variation is large, which is normal in fishing. (Details in method notes.)
What This Means
Fishing performance is driven by many things—stock movement, weather, quotas, and skipper decisions. Catchwise doesn’t “catch the fish.”
What we show is that since adopting Catchwise, vessels in the study improve their catch efficiency vs comparable vessels, on average.
This matches what skippers tell us: having catch history, AIS, weather, and ocean data in one place makes it easier to decide faster and with more confidence.

Catchwise has become an important tool in my daily operations. Artificial intelligence gives us better decision-making foundations, saves time, and contributes to more sustainable fishing. Catchwise is forward-thinking and innovative, showing how technology can make a real difference in modern fisheries.
Per William Lie
Skipper and Ship Owner, Liegruppen
What the Numbers Could Mean in Practice
If we translate the observed efficiency difference into operational terms — purely as an illustration — the aggregated effect across the fleet corresponds to roughly:
- ~654 fishing days saved
- ~15,686 fewer hours at sea for the same catch volume
Using a conservative estimate of 200 liters of diesel per hour, this equals approximately:
~3.1 million liters of diesel
~$3.5 million USD in fuel costs
~11,514 tons of CO₂
These are not guarantees. They are aggregated estimates based on observed behavior, meant to show scale — not to promise results.
The Variation Matters
27 out of 69 vessels went backwards relative to their own baseline. That matters, and we show it deliberately.
Some seasons are worse than others. Some vessels face quota or weather constraints. Some skippers change strategy independently of technology.
The median improvement (+5.0 percentage points) is important precisely because it represents a typical outcome, rather than being driven by a few extreme cases.
Who This Tends to Apply To
Based on both data and skipper feedback, Catchwise tends to be most useful for:
- Vessels fishing multiple areas or shifting grounds
- Skippers balancing weather windows, timing, and competition
- Crews already using AIS and historical data, but doing it manually
It may have less impact when:
- Fishing is highly specialized on a single ground
- Results are dominated by regulatory or quota constraints
- Operational patterns are already fixed and stable
Why We Publish This
We publish this analysis because we believe transparency matters more than marketing.
We show:
- The method
- The variance
- The limitations
- The cases where results did not improve
Catchwise is not a decision-maker. Skippers still make the calls. Our goal is to provide a better foundation for making them.
Method notes
- Customer periods include 316,121 hours at sea. The dataset spans 63,135 vessel-days before customers signed up and 13,229 vessel-days after.
- Results are weighted by hours at sea so short trips or inactive periods don’t dominate the average.
- Uncertainty was estimated with bootstrap resampling (1,000 simulations).
- The observed improvement is statistically significant (p < 0.01).
- Vessel-to-vessel variability is large (standard deviation: 32.5 percentage points).
Want to Dig Deeper?
Want to understand what your own efficiency data says — and how it compares over time?
- We can help you interpret your efficiency and fishing patterns
- We can talk through how to benchmark against comparable vessels
- We can show what Catchwise can (and can’t) support in your workflow
Contact us at hello@catchwise.com or via our contact page.
Try Catchwise
Try Catchwise on your next trip! Click the button below to get started. No credit card required.