15 September 2026
Why does food gather right here?
How Catchwise models where food for pelagic species gathers.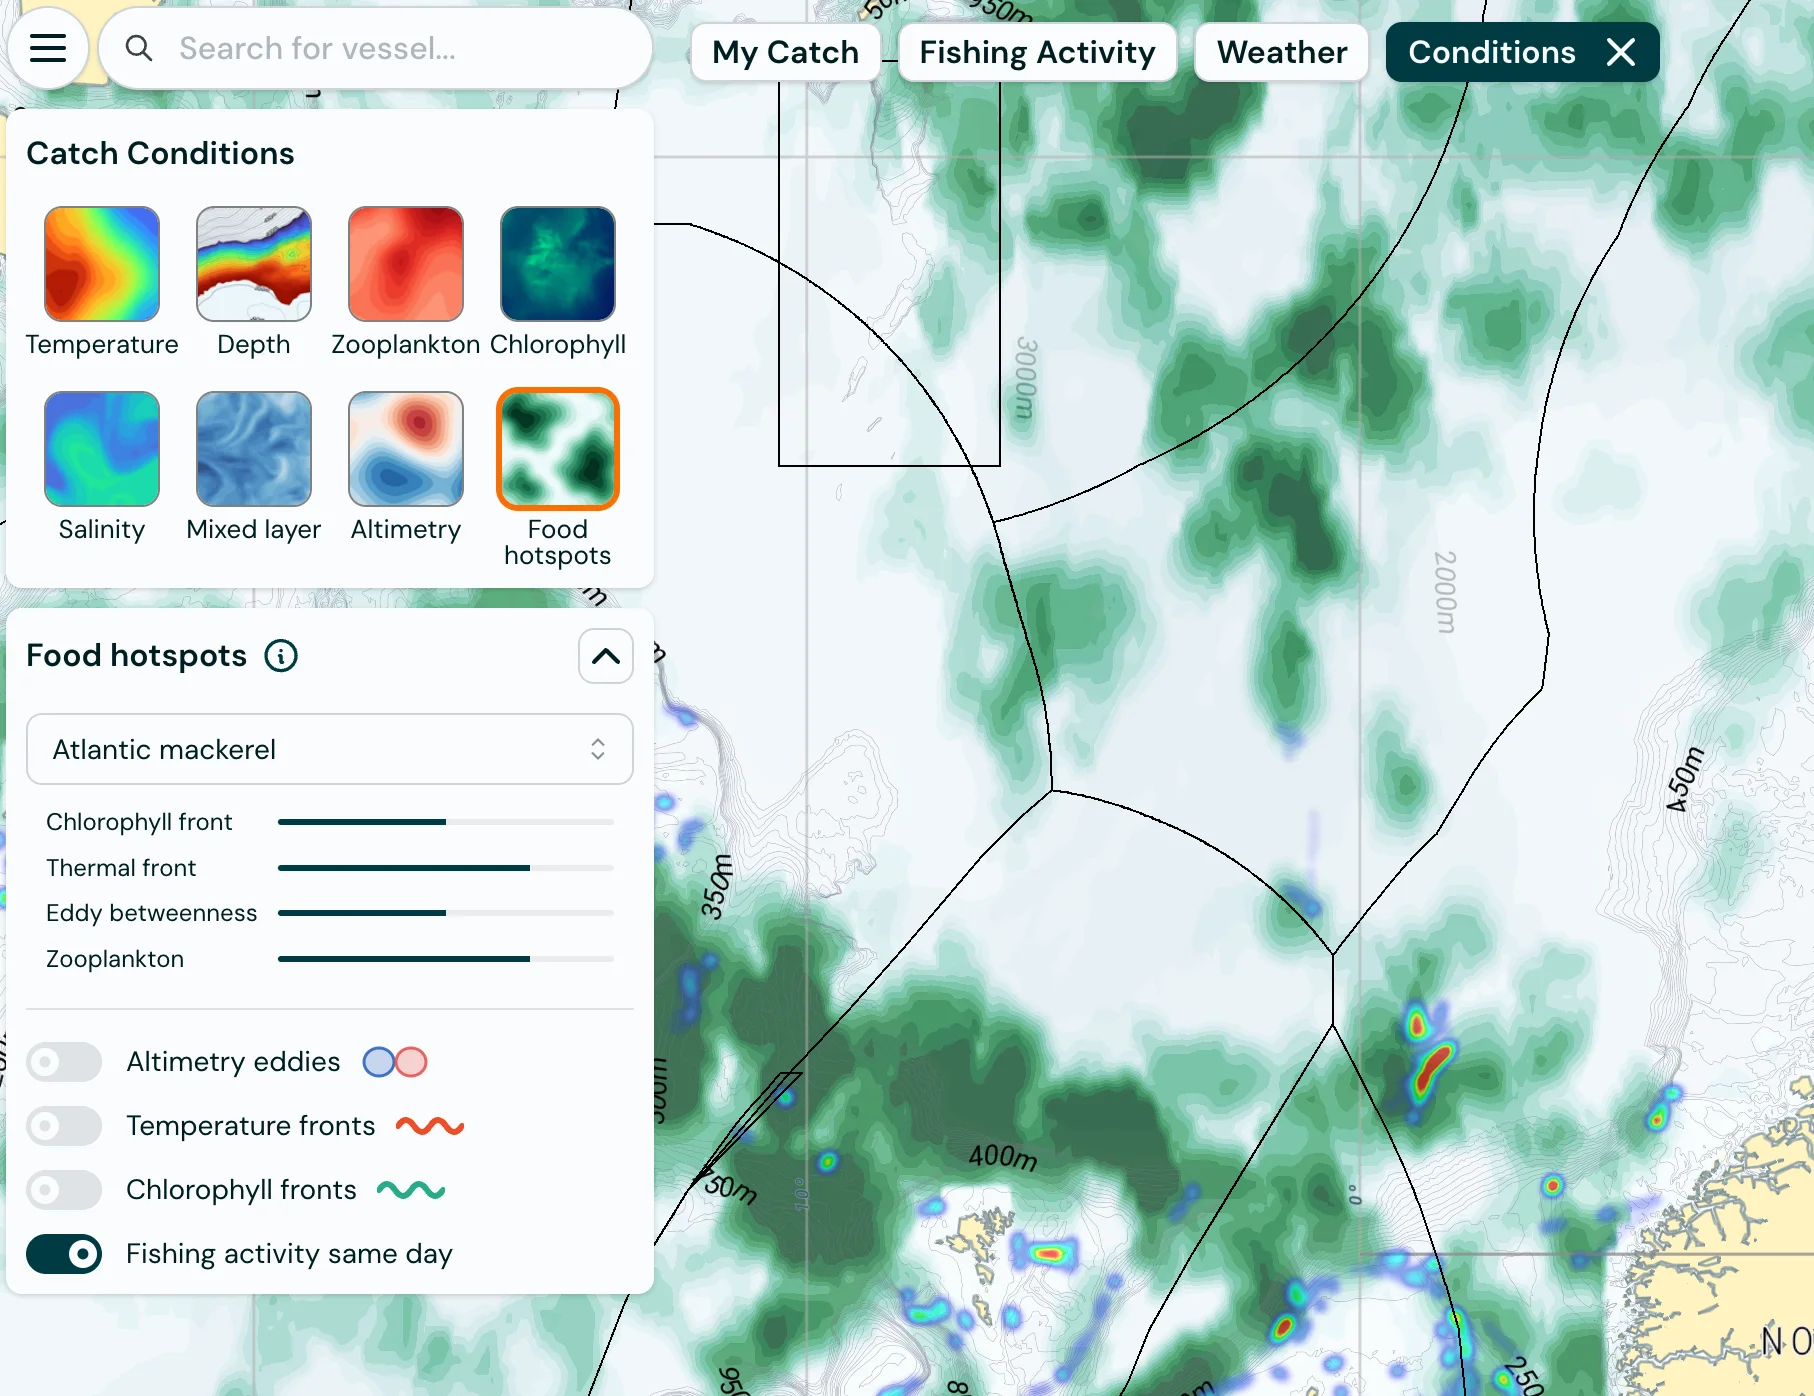
Fronts, eddies and Food hotspots on the same map.
The green areas on the map highlight places where the model identifies favourable conditions for food to concentrate. Behind the view are several signals about water masses and marine life. Here is how they fit together.
Satellite imagery reveals chlorophyll and transitions in the ocean
A satellite-based chlorophyll view with chlorophyll fronts highlighted.
Satellites measure ocean colour, which is used to estimate chlorophyll. Chlorophyll is an indicator of phytoplankton and provides information about the base of the food chain.
Catchwise also highlights chlorophyll fronts: areas where chlorophyll levels change markedly over a short distance. The fronts make it easier to see transitions between water masses, rather than simply reading a value at one location.
Temperature fronts provide another signal
Temperature fronts mark the transition between water masses at different temperatures. Where water masses meet, nutrients and plankton can concentrate in narrower bands than in the surrounding water. The fronts therefore show where the edges lie, not simply whether an area is warm or cold.
The model uses both temperature fronts and chlorophyll fronts. They describe different aspects of the conditions and can be considered together when an area is highlighted.
Eddies and zooplankton are part of the calculation
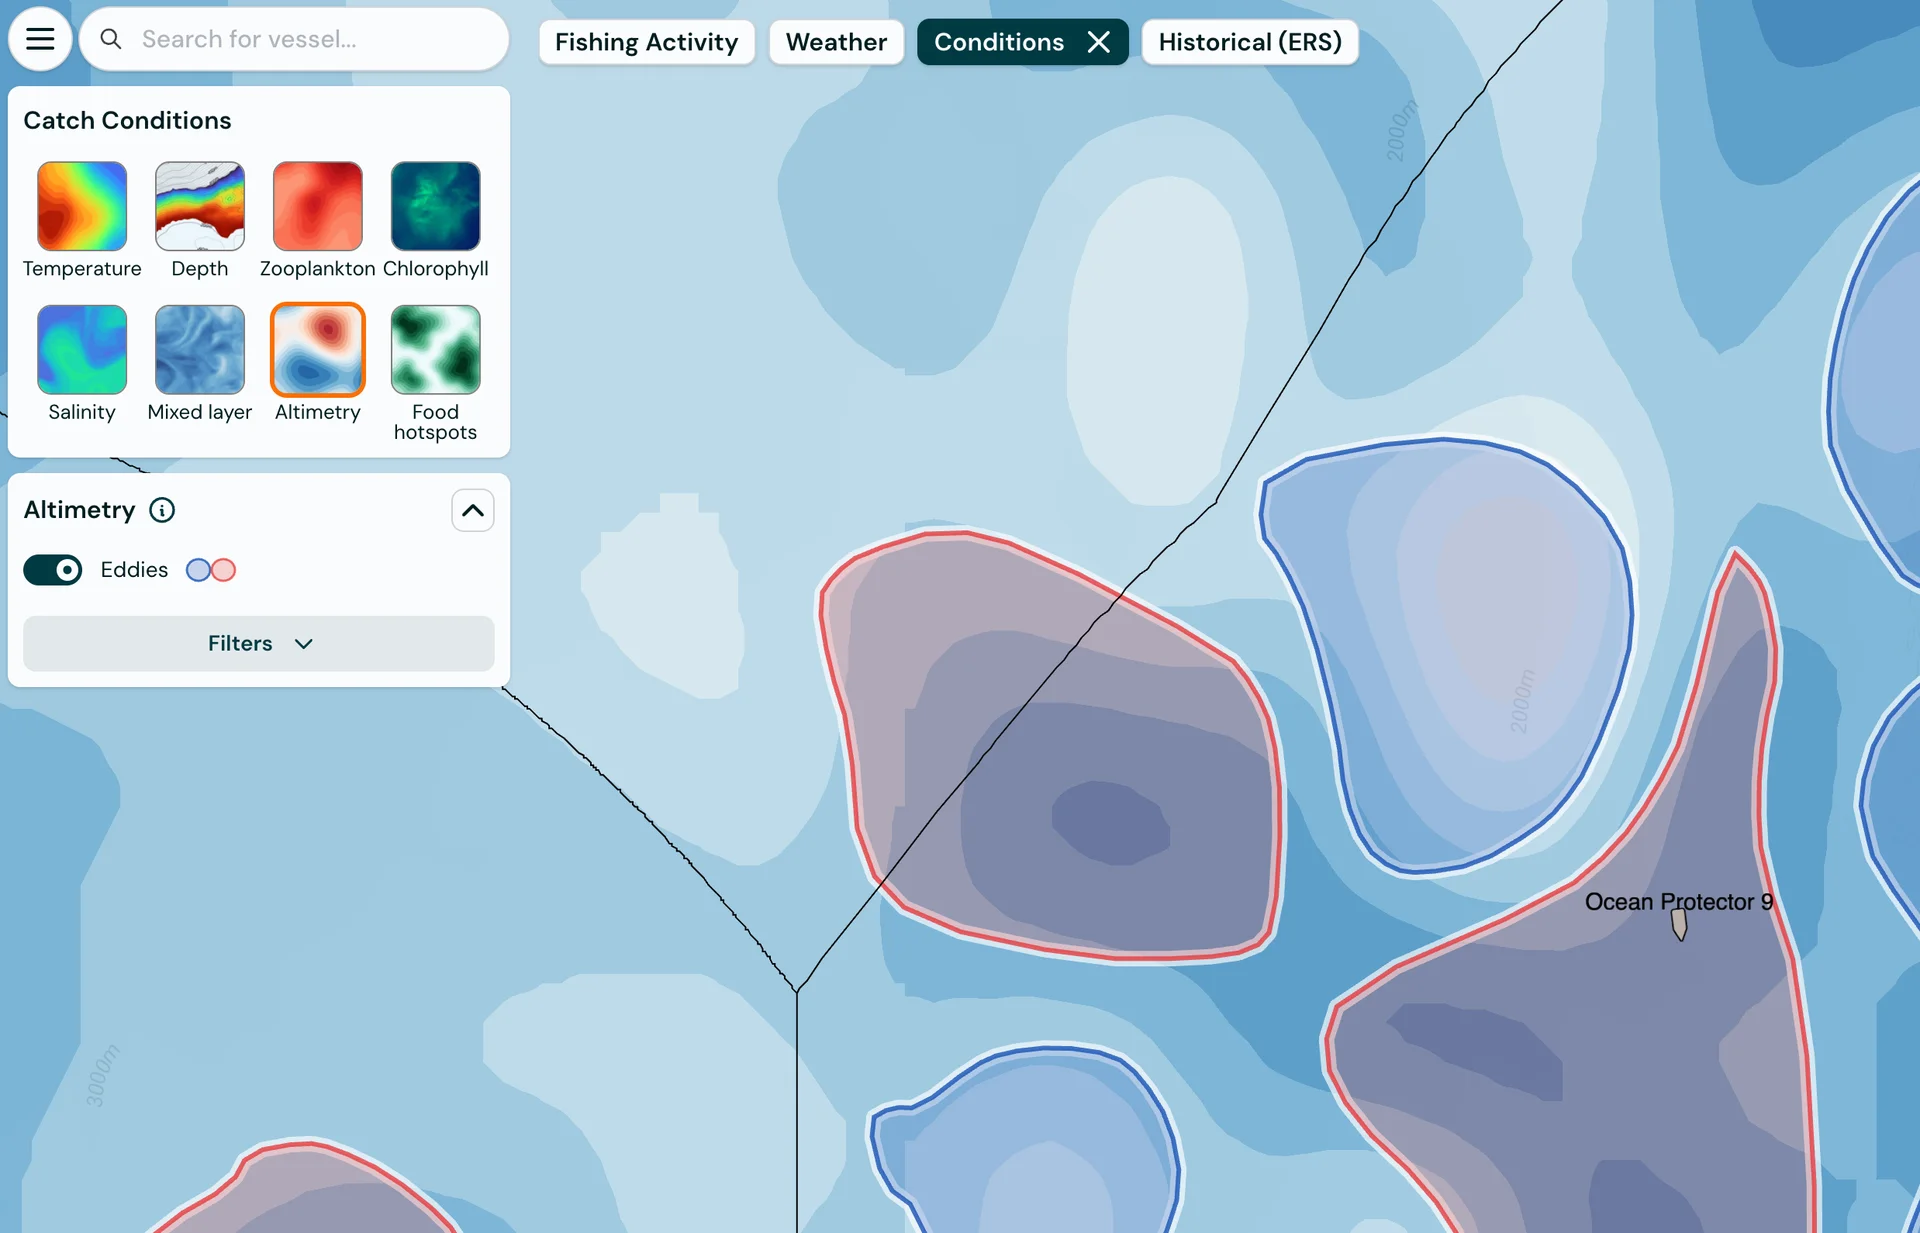
Eddies highlighted in the altimetry layer.
Eddies are rotating water masses that can retain and concentrate plankton. Catchwise uses information about eddy activity as part of the model. You can also view the eddies on the map under Altimetry.
Zooplankton is included as a separate factor. It is an important food source for pelagic fish, so estimated zooplankton concentrations provide relevant information alongside fronts and eddy activity.
Several signals become one view
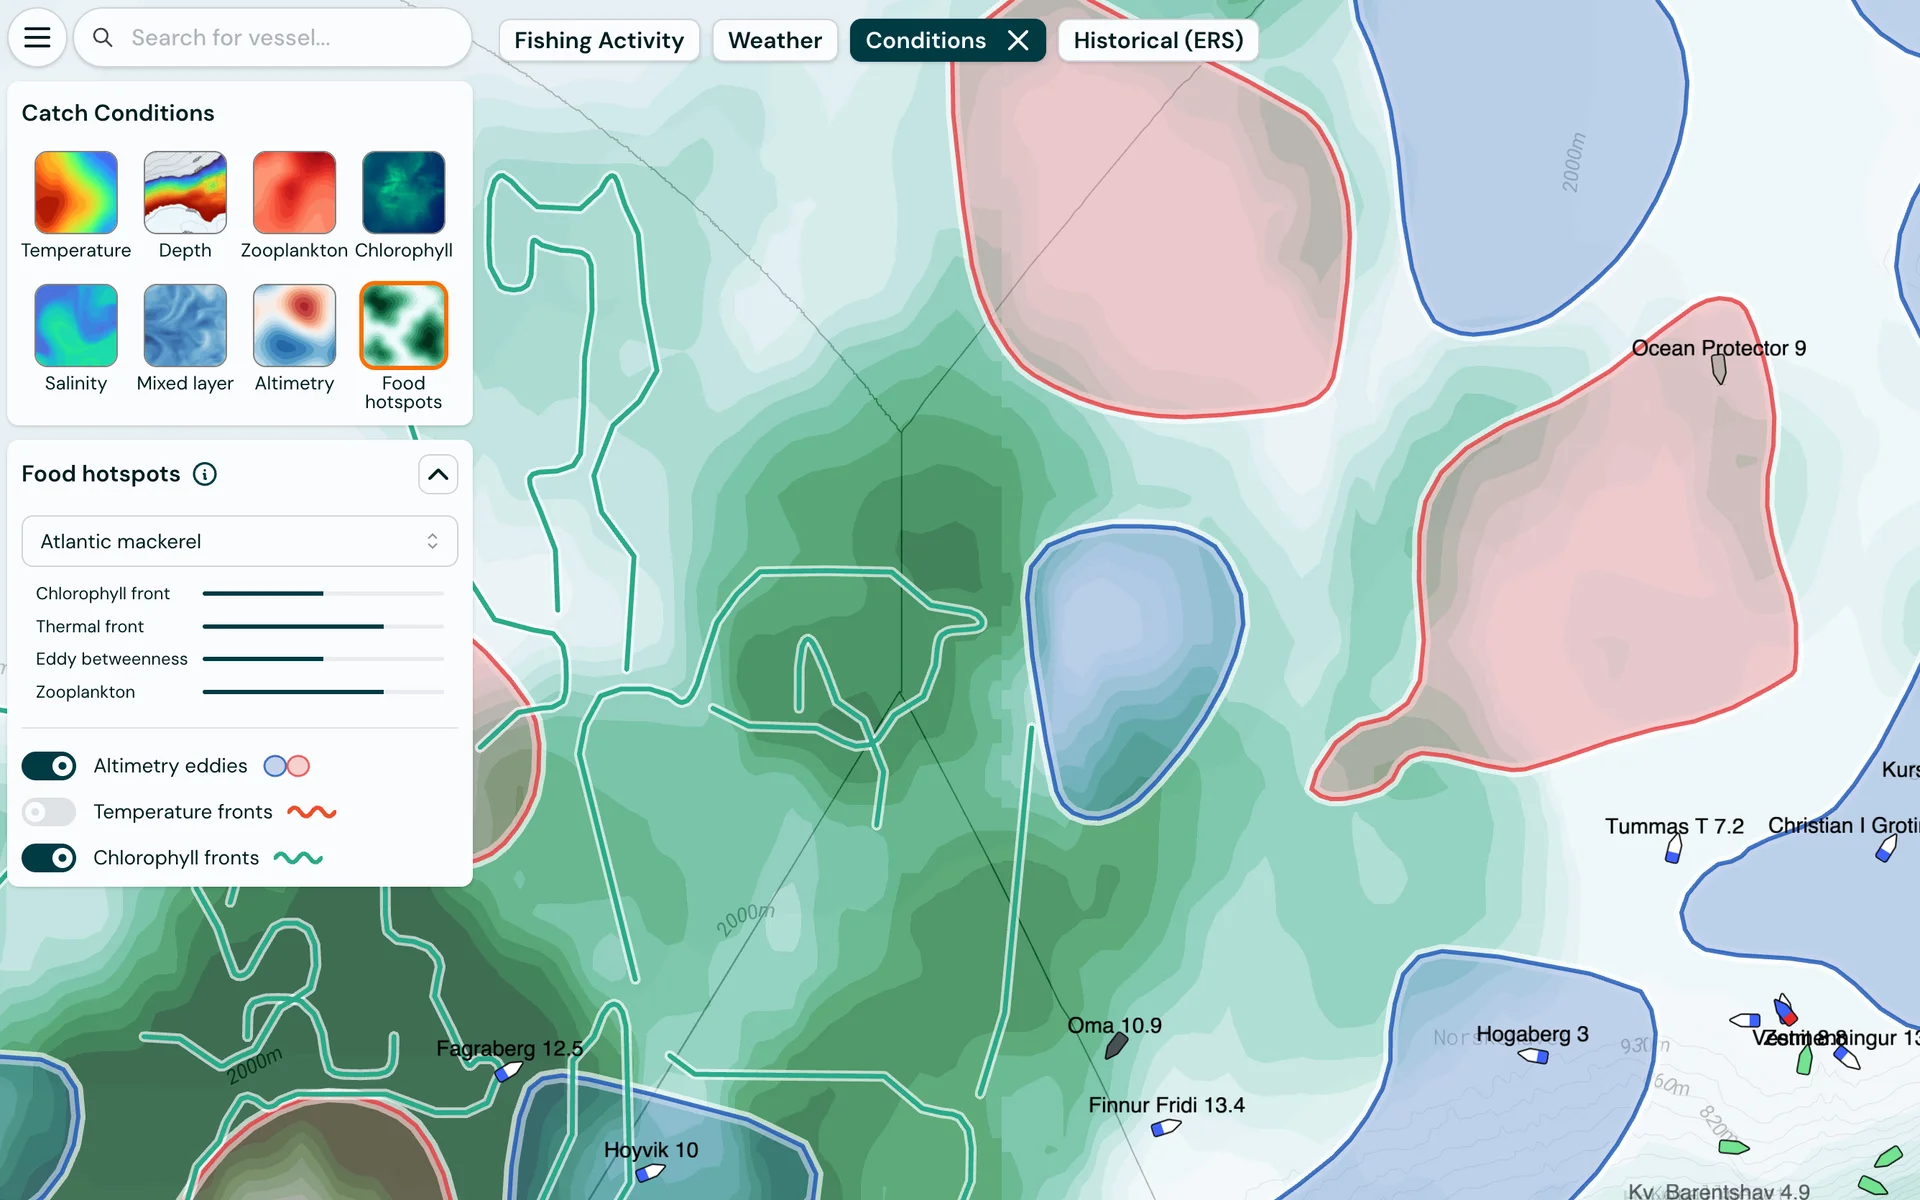
The map shows the combined model. The detailed view provides insight into the individual signals.
Catchwise combines the factors into an overall score that highlights areas where food is expected to concentrate. The weighting depends on the species you select. You can also fine-tune the factors yourself.
The score is a model assessment, not a measurement of how many kilos of food or fish are in the area. It makes it easier to identify zones worth a closer look.
Why use food concentration rather than zooplankton alone?
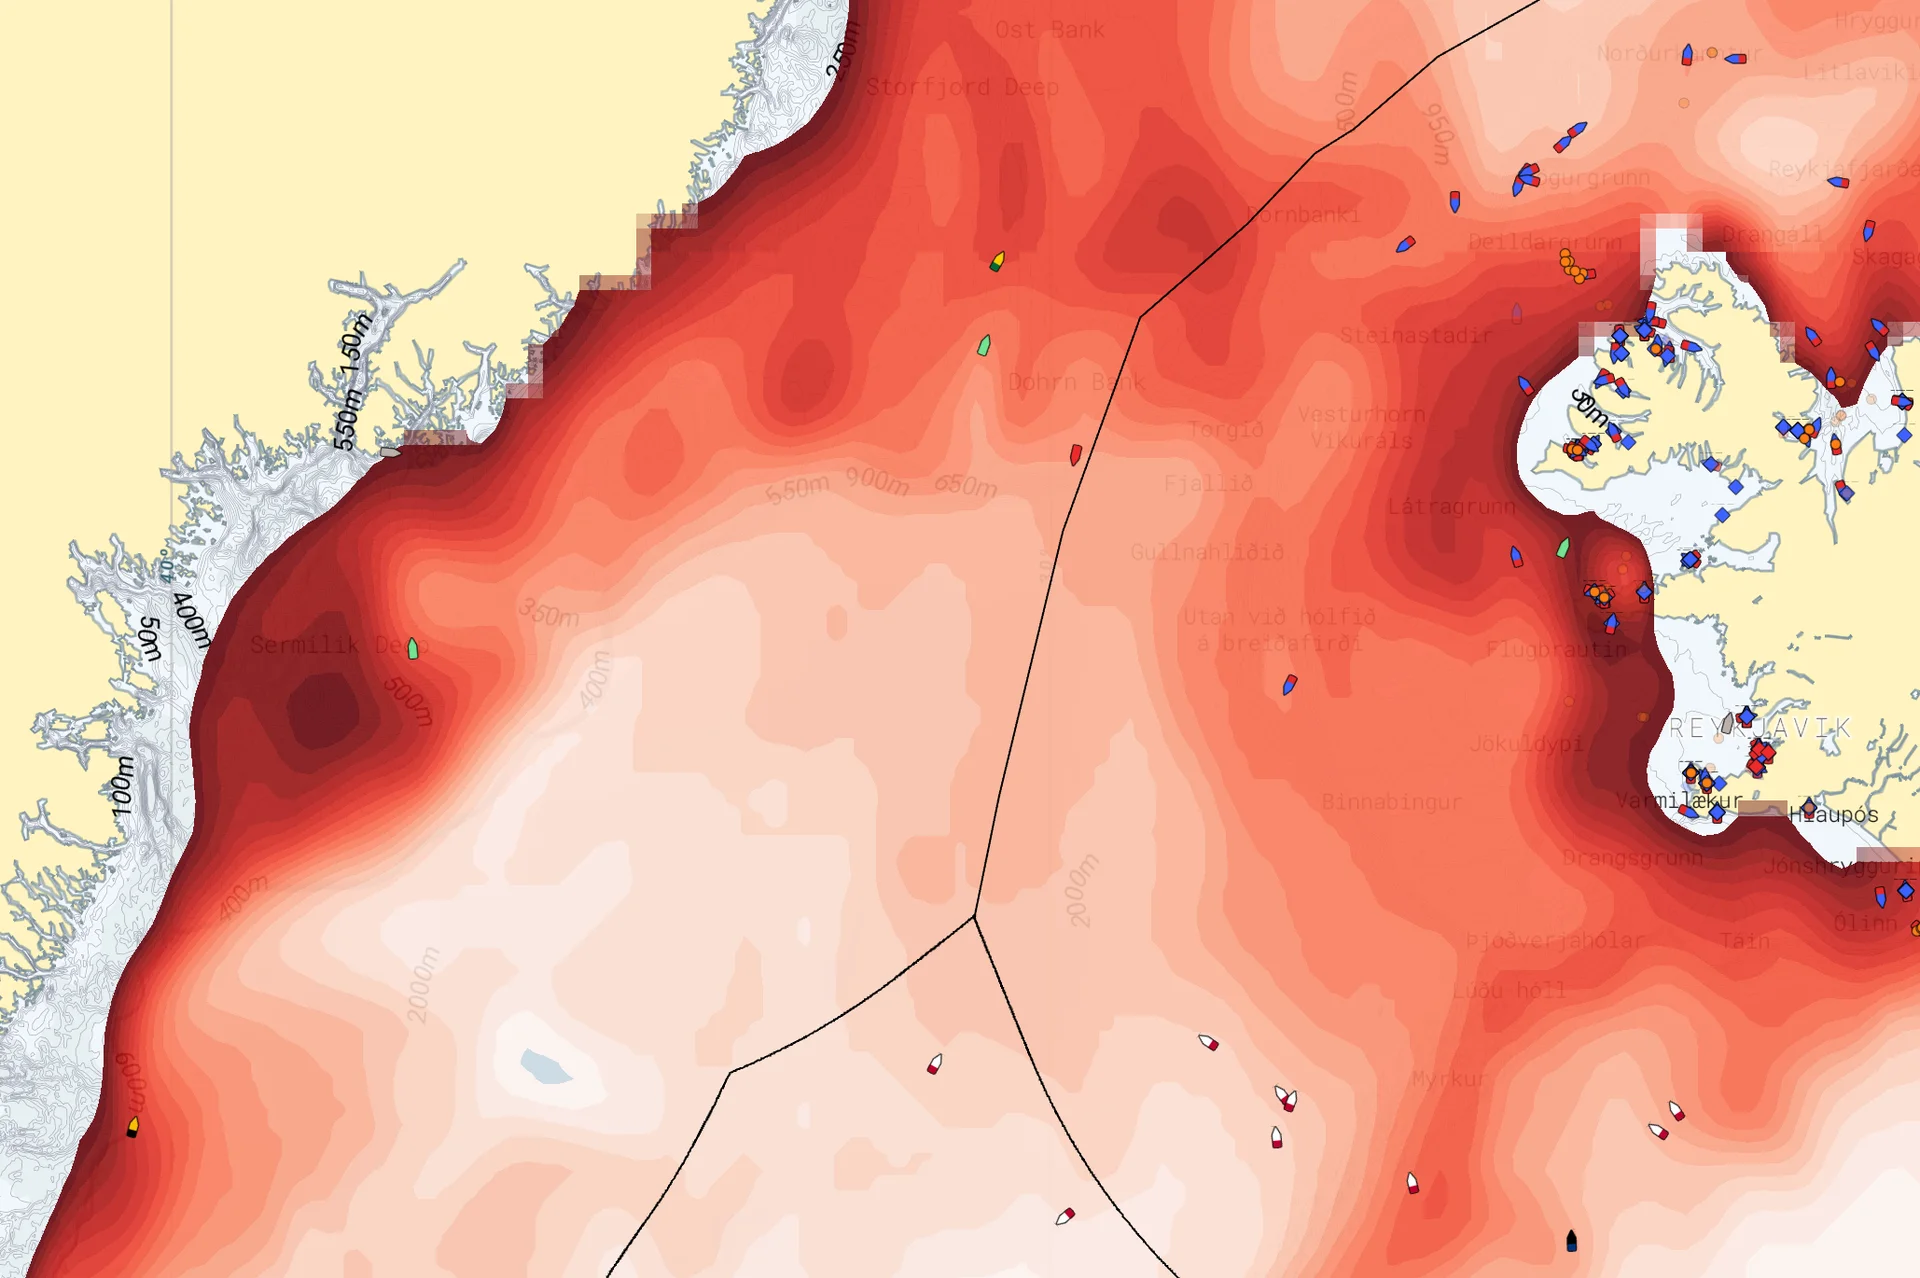
Modelled zooplankton concentration with fishing activity.
The zooplankton layer shows the modelled concentration of an important food source for pelagic fish. But the area with the most plankton is not necessarily the best place to start looking.
Think of it like a cake: you don’t start eating from the middle. The edges are often more interesting. Fronts mark boundaries between water masses, where food can gather and become available to feeding fish.
Modelled food concentration therefore combines zooplankton with temperature fronts, chlorophyll fronts and eddy activity. This gives you a combined assessment of both the food source and the conditions that can concentrate it, with weighting tailored to the species you target.
Use food concentration as a starting point when assessing potential fishing areas, and the zooplankton layer when you want a closer look at this particular food source.
Bring Food hotspots into your assessment
Look at the area alongside temperature, fishing activity and catch history. Has it produced fish before? Is the fleet fishing there now? How do the conditions compare with your own experience?
The Food hotspots layer adds information to that assessment. In Catchwise, you will find it under Conditions → Food hotspots.
See how the layer is used alongside fishing activity in Catchwise launches modelled food concentration for pelagic fishing.
Food hotspots is currently available only for pelagic species.
Try Catchwise
Try Catchwise on your next trip. Click the button below to get started. No credit card required.